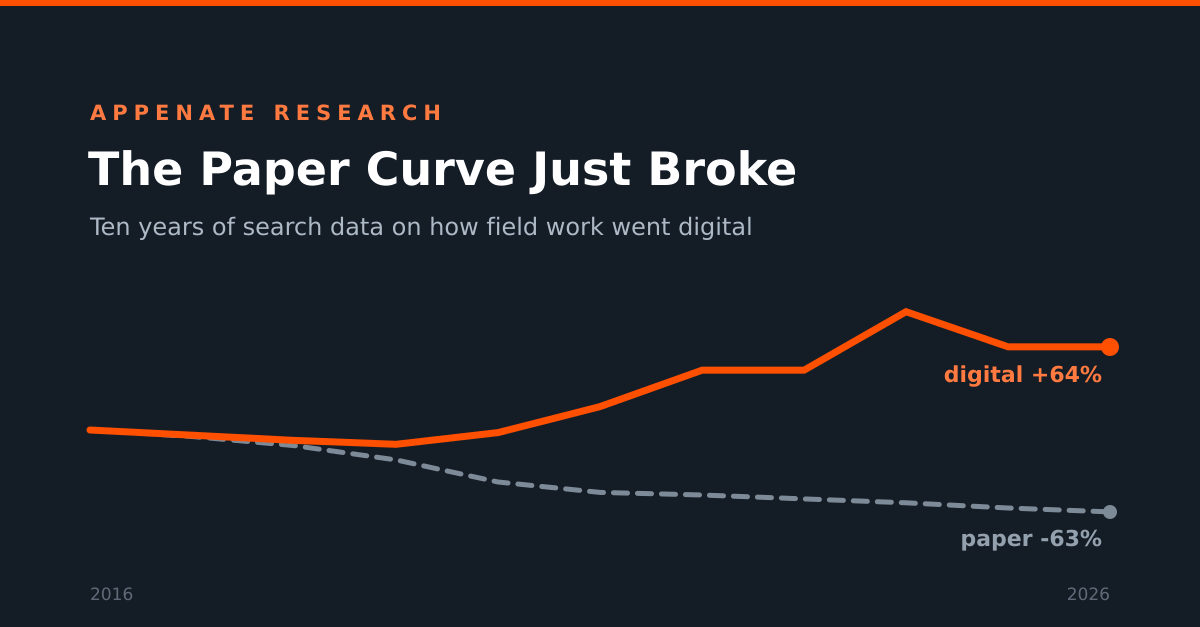
We tracked a decade of US Google search demand for the tools of paper-based field work against their digital replacements: eleven anchor terms at monthly resolution, 2016 through 2026, plus a 38-term basket for breadth. Paper-era demand has fallen to 37 percent of its 2016 level. Digital demand is up 64 percent. The break happened in one specific spring, it never healed, and it is still reshaping how tradespeople buy software today.
The book that stopped being searched for
Every trade ran on the same object for fifty years: the work order book. Three-part carbonless copies. One for the office, one for the customer, one that got lost in the truck. Nobody announced its retirement. People just stopped looking for it.
That is measurable. Google search volume is a record of intent. When thousands of people stop typing “work order books” and start typing “work order app,” an industry is telling you where it is going. So we pulled ten years of monthly search history for the vocabulary of paper field work and the vocabulary that replaced it, and read the story in the curves.
Key Findings
37%
Paper-era search demand left, vs its 2016 level. Digital rose to 164% of baseline.
Apr 2020
The break has a date: “carbonless forms” fell 56% below its 2019 average and never recovered.
2021
Every trade we measured broke out in the same year: HVAC, plumbing, and electrician software.
+209%
“Plumbing software”, the decade’s fastest climber. Electrician +131%, HVAC +53%.
January
Software-shopping season: 20% above November, the quietest month.
-14%
Digital searches dipped in 2025 as AI answers began absorbing queries. Expect undercounting from here.
And one thing that never happened: the spreadsheet detour. Searches for “work order template excel” fell 22 percent in 2020. Businesses went from paper straight to apps.
The Scissors
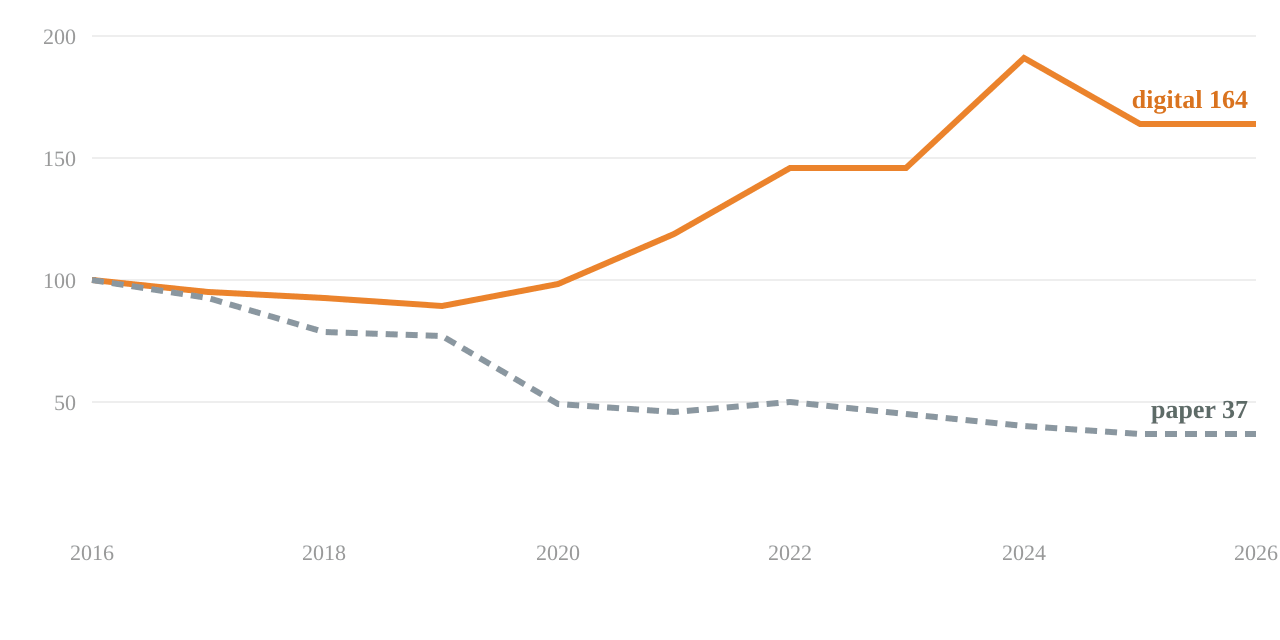
Index both sides to 2016 and the picture needs no caption: two lines that part ways and never look back. We built each side from three anchor terms. Paper: “work order books”, “carbonless forms”, “printable work order”. Digital: “work order app”, “work order software”, “field service software”. Yearly means of monthly Google volume, indexed to 2016 = 100.
The lines separate for good in 2020. But the shape on either side of that break tells three different stories, so we split the decade where the data splits it.
The Three Phases of The Paper Exit
2016–2019
The slow leak
Paper drifts from 100 to 77 while digital sleeps below its own baseline.
2020
The break
Paper collapses 77 to 49; “carbonless forms” falls 56% in a single April.
2021 →
The new default
Digital climbs to 191 by 2024; paper settles at 37 and never bounces.
Phase one: the slow leak, 2016 to 2019
Paper drifted from 100 down to 77. Nothing dramatic, just fewer people every year restocking triplicate forms. Here is the detail most retrospectives miss: digital demand was soft too, sitting at 89 in 2019, below its own baseline. The whole category was sleepy. Field service ran on habit, and habit does not search.
Phase two: the break, 2020
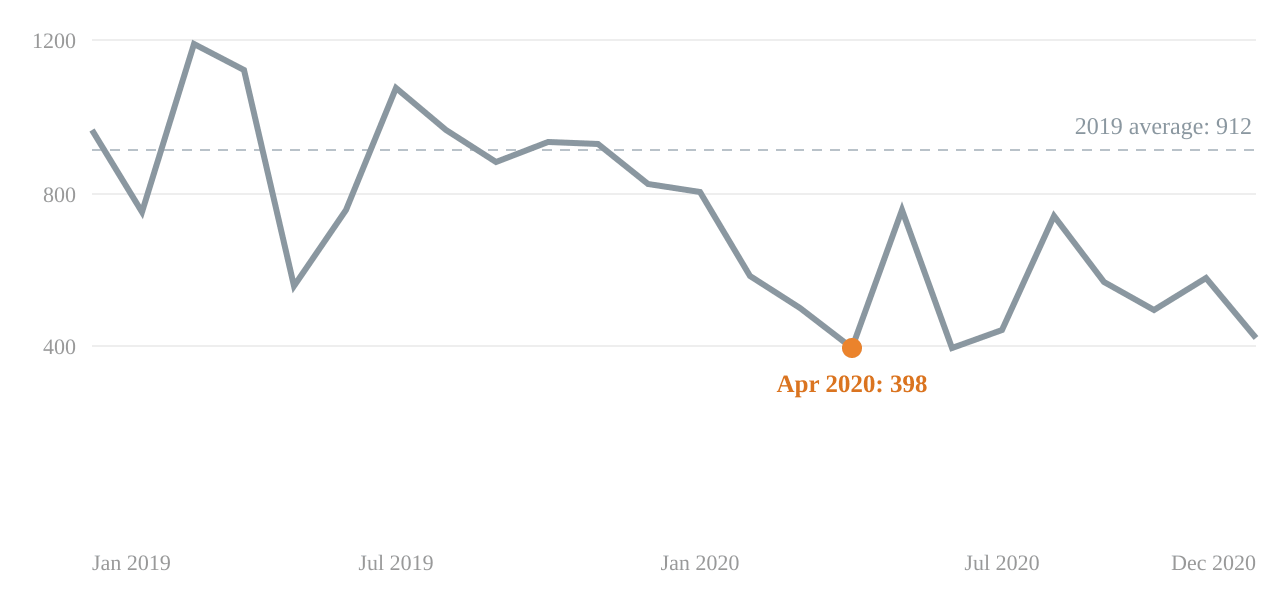
The paper index dropped from 77 to 49 in a single year, part of the same lurch forward that McKinsey measured across industries in 2020, when companies accelerated digitization by years in a matter of months. The monthly data pins it to spring. “Carbonless forms”, the highest-volume paper term we track, averaged 912 searches a month across 2019. In April 2020 it recorded 398, a 56 percent collapse. Before 2020 the term had never once dropped below 500 in our window; its worst month in four years was 556. In 2020 alone it went below 500 six times. The digital side, which had been sagging at 89, snapped back to 98 the same year.
Our reading: when offices emptied, the manila folder stopped being a viable interface between the office and the truck. A dispatcher could no longer hand a tech a printed work order. The paper supply chain of field work was severed in a single spring, and the searches show it.
Phase three: the new default, 2021 onward
The digital index climbed from 119 in 2021 to 146 in 2022 and touched 191 in 2024. Paper never bounced. It wobbled between 45 and 50 for three years, slid to 40 in 2024, then settled at 37. That non-recovery is the finding worth staring at. Industries recover from shocks all the time. Demand for paper field tools did not, because the shock did not destroy anything; it revealed the replacement.
The shock did not destroy anything. It revealed the replacement.
The spreadsheet detour that never happened
We expected a middle chapter in this story. The theory: businesses forced off paper in 2020 would detour through the familiar free option first, Excel templates, and only later graduate to apps. It is a sensible theory. The data refuses it.
Searches for “work order template excel” fell 22 percent in 2020, from 226 a month in 2019 to 177, its weakest year of the whole 2018 to 2026 stretch. It recovered to a modest peak of 257 in 2022 and sits around 210 today, up just 12 percent over the whole decade.
The broader template layer tells the same story. “Work order template” averaged roughly 2668 monthly searches in 2016 and 3155 in 2026, a move of 18 percent in ten years. While paper terms lost between half and 85 percent of their demand and the digital side rose 64 percent, the template layer held almost still.
Our reading: templates are not a detour on the road from paper to apps. They are a permanent middle layer, the halfway house that never empties. The 2020 wave went past that halfway house without stopping, which suggests template users are a different crowd, not an earlier stage of the same migration.
Which trade is digitizing fastest
We tracked software demand for three named trades across the decade. All three tell the same story on different scales, and they synchronized in one remarkable way: each crossed double its pre-2020 baseline in the same year, 2021.
| Trade | Decade growth, 2016 to 2026 | Breakout vs pre-2020 baseline |
|---|---|---|
| Plumbing software | +209% (337 to 1,041 monthly searches) | 2.2x, reached 2021 |
| Electrician software | +131% | 4.7x, reached 2021 |
| HVAC software | +53% | 2.0x, reached 2021 |
“Plumbing software” is the quiet winner, roughly tripling from 337 monthly searches in 2016 to 1041 in 2026, with its best year in 2025. “Hvac software” is the biggest absolute market of the three, averaging 1418 searches a month in 2016 and 2173 now, with a peak year of 2024 averaging 3729. “Electrician software” is the smallest and noisiest series, so treat its 4.7x breakout as directional, but the direction is unambiguous.
Our reading: HVAC already had the biggest software search market in 2016, so it had the least headroom left. Plumbing started small and is climbing fastest. If you sell to the trades, the plumbing curve is the one to watch.
When owners actually shop for software
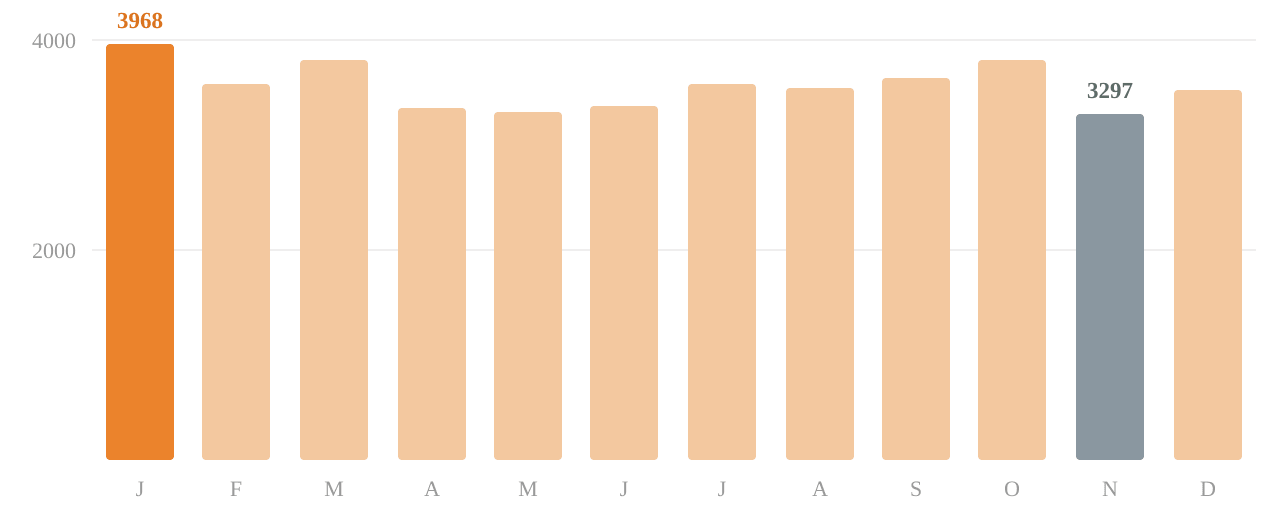
Ten years of monthly data lets us average out the noise and ask: is there a season for this? There is. Averaging the three core digital terms across the ten full years 2016 through 2025, January is the busiest month for software searches, running 20 percent above November, the quietest. March and October are the next two busiest.
Our reading: the pattern maps onto trade life. Owners evaluate systems when the calendar resets and in the shoulder seasons, and they stop looking in the late-spring rush and again in November. If you plan to change how your business runs, the search record says January is when people like you actually go looking. If you publish or sell to this market, that is when the audience shows up.
The 2024 peak and the AI wrinkle
The digital index peaked at 191 in 2024, then fell to 164 in 2025, a 14 percent drop, and held exactly there through July 2026. After a decade of climbing, that is a real change of shape. Did field businesses stop going digital?
We doubt it, and the timing points somewhere specific. Google began rolling out AI Overviews to US users in May 2024, and AI assistants have been absorbing exactly this kind of query since: what software a plumbing company should use is now a question people ask a chatbot, not a search box. We want to be precise here: this is a correlation, not a proven cause. The dip could also reflect a market cooling off after the post-2020 buying wave.
But it leads to our one prediction: from here on, search volume will increasingly undercount the digitization of field work. The migration will continue while the search lines flatten, because the asking moved somewhere harder to measure. This study uses search demand as its ruler, and we are telling you openly that the ruler has started to shrink. Whoever measures this next year should read a flattening curve with that in mind.
Where the curve points
If the post-break glide of the last six years simply continues, the paper index lands around 26 by 2030, roughly a quarter of its 2016 level. That number is a projection, not data: a straight line fitted to the 2021 through 2026 index values and extended four years, disclosed in full in the methodology.
We are deliberately not projecting the digital line, even though it has added 9.3 index points a year since 2021, because the AI wrinkle above means its future values will measure search behavior as much as software demand. The honest forecast is one line, not two.
If Your Business Still Runs On Paper
The curve is not a judgment. Plenty of excellent businesses still run on triplicate forms. But it does mean three practical things.
- You are no longer early. The paper index has already fallen 63 points from its 2016 baseline of 100; by that ruler the migration is roughly two thirds done. The technology matured while it fell.
- Your next hire has probably never filled out a carbonless form. The workforce entering the trades learned to type before they learned to drive. Paper is now the system that needs training.
- Start with one form, not a transformation. Our advice: digitize your single most-repeated document first, usually the work order or the inspection checklist, and let the rest follow.
Where Appenate Stands
This curve is the reason our company exists. Appenate turns paper forms and checklists into mobile apps that field crews actually use, which places us, openly, on the rising line of the chart above. Read this study knowing that.
We will say only one promotional sentence: if the curve convinced you and you want to see what your most-repeated paper form looks like as an app, the free trial takes an afternoon, not a transformation.
Methodology
Search demand data: monthly US Google search volume, January 2016 through July 2026, from Ahrefs Keywords Explorer volume history, pulled July 17, 2026, for eleven anchor terms.
- Anchor terms. Paper: “work order books”, “carbonless forms”, “printable work order”. Digital: “work order app”, “work order software”, “field service software”. Hypothesis tests: “work order template”, “work order template excel”. Trades: “hvac software”, “plumbing software”, “electrician software”.
- Indexing. Yearly means of monthly volume with 2016 = 100; 2026 covers January through July.
- Seasonality. Month-of-year mean of the three digital anchors over the ten full years 2016 through 2025.
- Trade breakout years. The first year at or above double the 2016 through 2019 mean.
- The 2030 figure. A linear least-squares fit on the 2021 through 2026 yearly index, extrapolated. It is a projection, not a measurement.
- The 38-term basket check. Google Ads search volume via DataForSEO, US, same pull date, trailing twelve months (July 2025 through June 2026). On that basket, digital demand runs at 1.94 times paper demand, and its 2026 monthly average ran 41 percent above late 2025 while paper stayed essentially flat. One low-volume paper term returned no data and is excluded from both periods.
Limitations we want you to know: search demand measures intent, not adoption. Keyword baskets are samples of a vocabulary, not the whole of it. Low-volume series before 2020 are coarsely quantized in the source data, which is why we treat the “electrician software” multiples as directional. And AI answer engines are starting to absorb queries that used to be searches, which will depress all of these curves independently of what field businesses actually do. Raw exports and the analysis script are preserved and available on request.
You are welcome to cite this study, including the charts, with a link back to this page.