Read time: 7 minutes
After working with 400+ enterprise companies in construction, logistics, manufacturing, and utilities, we discovered a pattern. In this blog article we share our complete analysis with you. With the Assessment below you will be able to see what level your company is at.
The $2 Million Problem
Mike is the COO of a manufacturing company with 1,200 employees across 8 plants.
Last year, his company invested:
- $200K on Power BI Embebbed
- $400K hiring a data analytics team
- $1.3M on consultants for “digital transformation”
- $100K+ on AI platforms and trainings
Total: over $2 million to become a “data-driven company.”
Six months later, Mike tells me on a call:
“”We have beautiful dashboards. But the numbers don’t add up. Last week, production data from Plant 3 showed a 15% drop, turns out someone mistyped a value in the form. By the time we realized it, every report and decision based on that data was already wrong, and late””
I asked him: “Where does the data feeding those dashboards come from?”
Silence.
Then: “Well… supervisors fill out forms on tablets, someone transfers them to Excel. Then… I think they get uploaded to SharePoint. And from there they go to Power BI.”
There was the problem.
Mike had invested on the roof of his data house, but the foundation was made of manual typing, Excel and disconnected workflows.
Why Your Company Spends Millions on Analytics But Still Makes Decisions Blind
There’s a reason why some companies gain real competitive advantage from their operational data… and others don’t.
It’s called The Data-to-Insights Hierarchy.
It’s a 5-level pyramid that shows the path from “capturing data in the operation” to “making decisions that give you competitive advantage.”
Here it is:
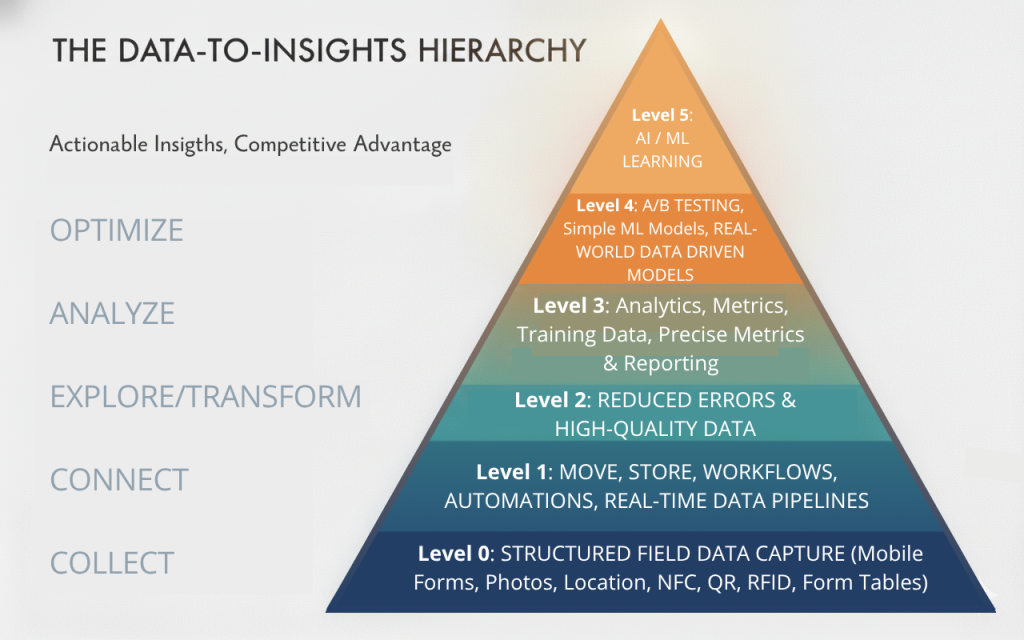
Level 1: COLLECT
Structured operational data capture
This is where EVERYTHING starts. Your operational team generates data constantly:
- Inspections
- Maintenance
- Deliveries
- Installations
- Audits
The problem: Many companies capture data from different media or in apps not designed for complex operations, losing the ability to achieve the necessary data consistency.
Result: Data that arrives late, incomplete, with errors, or never arrives at all.
Level 2: CONNECT
Reliable data flow to your systems
Once you’ve captured the data, it has to MOVE.
From the technician’s tablet → To your CRM
From the inspector’s app → To your ERP
From the operatinoal supervisor → To your reporting system
The problem: Most companies rely on manual processes. Someone has to “transfer” the information. Or data syncs once a day. Or there’s a CSV in between.
Result: Data that exists but doesn’t flow. Silos. Latency. Friction.
Level 3: EXPLORE/TRANSFORM
Clean, high-quality data
This is where you start PREPARING data to actually be useful.
You clean errors. Normalize formats. Remove duplicates. Transform raw data into useful data.
The problem: If levels 1-2 are broken, you spend 80% of your time CLEANING garbage instead of ANALYZING.
Result: Your data analytics team becomes a “data janitors” team.
Level 4: ANALYZE
Precise metrics and real-time reporting
This is where Power BI, Tableau, Looker, and all the pretty dashboards live.
Finally you can see:
- What’s happening in your operation
- Where the problems are
- Which metrics are out of range
The problem: If you got here with poor quality data or 24-48 hour latency, your analysis is perfectly accurate… about information that no longer matters.
Result: “Garbage in, garbage out” but with beautiful dashboards.
Level 5: OPTIMIZE
Real competitive advantage
This is the level where you actually make money.
Process A/B testing. Predictive models. Machine learning on your operational data. Decisions your competition can’t make because they don’t have the data.
The problem: Only 5% of companies reach this level. Not because they lack budget. But because their levels 1-2 are broken.
Result: The competitive advantage you were looking for never arrives.
The Main Issue: You’re Investing at the Wrong Level
Back to Mike.
His company spent $2M on levels 4-5 (Analytics and Optimization).
But his level 1 (Collect) was broken:
- Supervisors filling out paper forms
- Data arriving 24-48 hours later
- Incomplete or error-filled information
His level 2 (Connect) was broken:
- Someone had to manually “transfer” the data
- Excel as an intermediary
- Zero automation
So he spent millions building a Ferrari (level 4-5)… on square wheels (level 1-2).
And he wondered why he wasn’t moving forward.
What Level Is Your Company At?
The Hard Truth
If your company is stuck at levels 1-2, it doesn’t matter how much you invest in levels 4-5.
It’s like trying to fill a pool with a hose that has 20 holes. You can buy a more powerful pump (better BI tool). You can hire someone who knows how to use it better (data analyst). But the water keeps escaping through the holes.
You need to fix the hose first.
How Real Companies Climbed the Pyramid
Case 1: Construction Company (500 employees)
Before:
- Level 1: Paper inspections
- Level 2: Someone transferred data to Excel at end of day
- Latency: 24-48 hours
- Accuracy: ~60% (incomplete, illegible data)
After fixing levels 1-2:
- Level 1: Structured digital capture with field validations
- Level 2: Real-time data flowing to their ERP
- Latency: Less than 5 minutes
- Accuracy: 98%+
Impact on upper levels:
- Their reporting team stopped spending 15 hours/week cleaning data
- They implemented predictive alerts (level 5)
- They detect problems 2 days BEFORE they escalate
ROI: 80% reduction in admin time. Recovered investment in 4 months.
Case 2: Utilities Company (2,000 employees)
Before:
- Level 1: Multiple systems (some paper, some digital)
- Level 2: 5 different systems that didn’t talk to each other
- Level 3-4: Impossible to consolidate data for analysis
After fixing levels 1-2:
- Level 1: Unified capture on a single platform
- Level 2: Automatic integration with SAP, Salesforce, SharePoint
- Level 3-4: Automatic consolidation in Power BI
Impact:
- Reduced 12 systems to 1 at the capture layer
- Eliminated 3 FTEs dedicated to “transferring information”
- Their COO now sees real-time metrics instead of weekly reports
ROI: $450K/year in eliminated costs + impossible-to-quantify operational visibility.
What To Do With This Information
If you identified with Mike (spending on levels 4-5 while 1-2 are broken), here’s your playbook:
Step 1: Honestly diagnose where you are
Use the Assessment above. Be brutal. Don’t lie to yourself.
Step 2: Fix level 1 FIRST
Before buying another BI tool or hiring more analysts, ask yourself:
Is my operational data captured:
- In a structured way?
- Complete?
- On time?
- Without friction for my team?
If the answer is no to any of these, start here.
Step 3: Make sure level 2 has no friction
Your data must FLOW automatically. No CSVs., “someone transfers the info.”. No silos.
If you have to say “then we sync” or “someone uploads that,” you have a problem.
Step 4: Only then invest in upper levels
With solid levels 1-2, your investment in analytics, BI, and optimization will bear real fruit.
Without solid levels 1-2, you’re throwing money away.
Why This Matters Now
It’s almost 2026. Competitive advantage no longer comes from:
- Having more people
- Working more hours
- Having better prices
Competitive advantage comes from making better decisions faster than your competition.
But you can’t make better decisions with data that:
- Arrives late
- Is incomplete
- Isn’t reliable
Your competition is fixing their levels 1-2 right now.
Are you?
The Platform Issue
A final note on technology.
When evaluating data capture platforms (mobile forms, operatinal service apps, inspection tools), ask this:
“Does this platform let me CLIMB the pyramid… or tie me to level 1 forever?”
Some platforms:
- Give you data capture (level 1)
- But then your data lives ONLY in their ecosystem
- If you want to do something custom at levels 3-4-5, you depend on them adding it
- They keep you hostage at level 1-2
Other platforms:
- Give you data capture (level 1)
- BUT the data is yours from day 1
- It flows automatically where you want (level 2)
- You have open APIs to build whatever you need at levels 3-4-5
- They prepare you to scale
Appenate is in the second group.
We built the platform with an obsession: that your operation never gets stuck at levels 1-2.
That’s why:
- Structured, validated capture in real-time
- Automatic connection with any system you use
- Completely open APIs
- Your data is yours, not ours
We don’t compete with your Power BI. We don’t compete with your ERP.
We’re the foundation that makes all of that actually work.
Next Steps
If this article resonated with you, you’re probably in one of these situations:
A) You know your level 1-2 is broken but don’t know where to start
→ Schedule 30 minutes with a specialist. We’ll show you exactly where your blind spots are and how to fix them.
B) You want to see industry-specific cases
→ See our case studies from construction, logistics, manufacturing, utilities and more.
C) You want to test if Appenate is the right solution
→ Start a 90-day trial for $90. We’ll help you build your first app risk-free.
D) You just want to keep learning
→ Read some article from this Blog. You can get maybe some cool insigths for your bussines.
About the author:
Juan Pablo Moreno is Growth Marketer at Appenate, where we help enterprise companies eliminate operational blind spots and build solid data foundations.
Share This Article
If you know a COO, IT Manager, or Operations Director who’s investing millions in analytics but still making decisions blind, share this article with them.
It could save them years of frustration (and millions of dollars).
Tags: Data Strategy, Digital Transformation, Operations, Field Service, Mobile Forms, Analytics, Ai, Bi, Data-Driven Decisions
Sources:
https://www.strategysoftware.com/blog/the-top-challenges-in-ai-analytics-and-how-leaders-are-overcoming-them
https://www.artificialintelligence-news.com/wp-content/uploads/2025/08/ai_report_2025.pdf
https://hai.stanford.edu/ai-index/2025-ai-index-report
https://barc.com/business-intelligence-trends/
https://pellera.com/blog/top-5-ai-adoption-challenges-for-2025-overcoming-barriers-to-success/
https://www.mckinsey.com/capabilities/mckinsey-digital/our-insights/superagency-in-the-workplace-empowering-people-to-unlock-ais-full-potential-at-work
https://www.artefact.com/blog/is-business-intelligence-still-a-thing-in-2025/
Last updated: October 2025